
I was researching a couple of numerical facts from fiscal year 2010-2011, a few from 2011-2012 so far for the next edition of Finding the Sweet Spot, and things got a little out of hand. If nothing else, there is definitely some bar betting money to be made. Hopefully there is a little something interesting for everyone. I’ll let you draw your own conclusions and opinions from the facts and perhaps collectively we can write the story in the comments section.
805,363 - Resident Population of San Francisco
697,711 – SF Residents 18 years and Older
437,073 – Jobs in SF
522,229 – Non-SF Residents Commuting to SF
102,279 – SF Residents Commuting out of SF
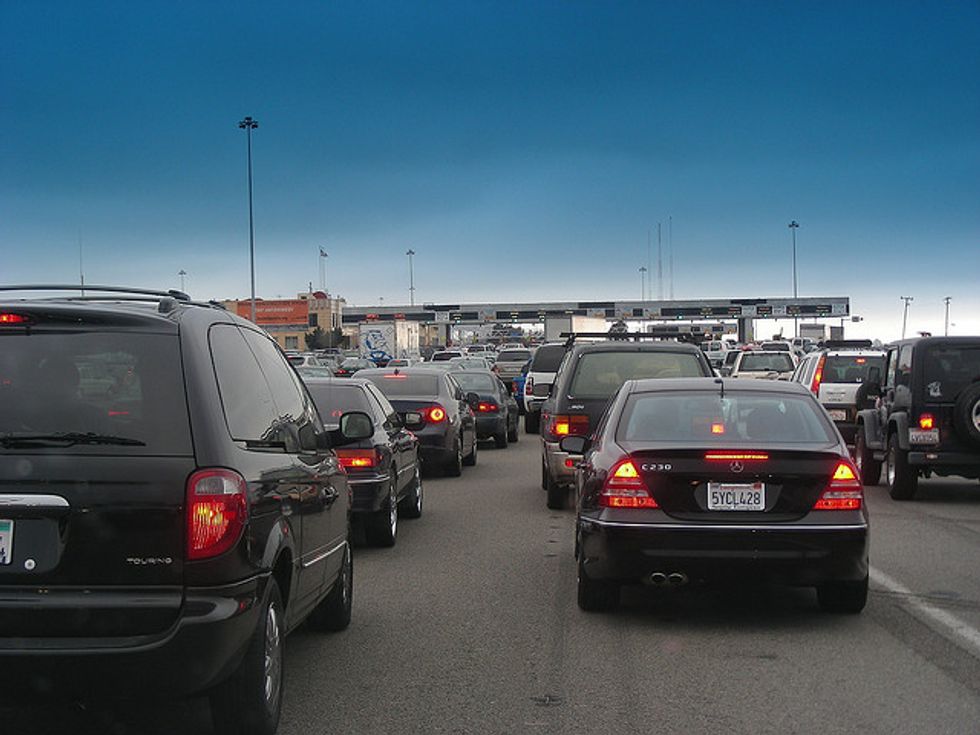
382,167– Number of Cars
58,641 – Number of Trucks
20,728 – Number of Motorcycles
281,700 – Total Off-street Parking Spots
29,103 – Total Number of Parking Meters
22% - Households with no Motorized Vehicles
35,400 – Daytime Increase in Vehicles
946 - Miles of Street
65 - Miles of Park Streets
254 - How Wide The Widest Street is (Junipero Serra Blvd)
7.29- How Many Miles the Longest Street is (Mission Street)
177- How Old the Oldest Street is (Grant Avenue)
9.4 - Percentage of San Franciscans that Walk to Work
3.5 - Percentage of San Franciscans that Bike to Work
44 – Percentage of San Franciscans that Drive Alone or Carpool to Work
1921 - The Year that the First Traffic Signal was Installed in SF
1947 - The Year that the First Parking Meter was Installed in SF
146,000 - Number of Parking Restriction and Regulatory Signs
54,000 - Number of Street Name Signs
900 - Miles of Striped Streets
24 - Number of Red Light Camera Intersections
11,527- Number of Red Light Camera Violations Issued
695 - Non-Fatal Pedestrian Collisions
17- Fatal Pedestrian Collisions
531- Non-Fatal Bicycle Injury Collisions
1- Fatal Bicycle Collision
673,196 – Muni Boardings per Day
506 – Diesel Buses
151– Light Rail Vehicles
40– Cable Cars
40– Historic Street Cars
8.8 – Miles of Cable Car Track
106 – Miles of Class I and Class II Bicycle Lanes Combined
2,444 – Bicycle Racks
1537 – Taxi Medallions
3983 - Yellow Zones
1,661 - White Zones
372 - Green Zones
564 - Blue Zones
58 - Taxi Zones
$40,520,486 – Annual Meter Revenue
$1,435 -Annual Revenue Per Meter
$86,306,584 – Parking Ticket Revenue
31 – Electric Vehicle Chargers
29 – Residential Parking Permit Areas
328 – Parking Control Officers
35 – Parking Control Supervisors and Assistant Directors
25– Parking Control Dispatchers
If you enjoyed this list but still haven't had your fill of facts, click here.